Executive Summary
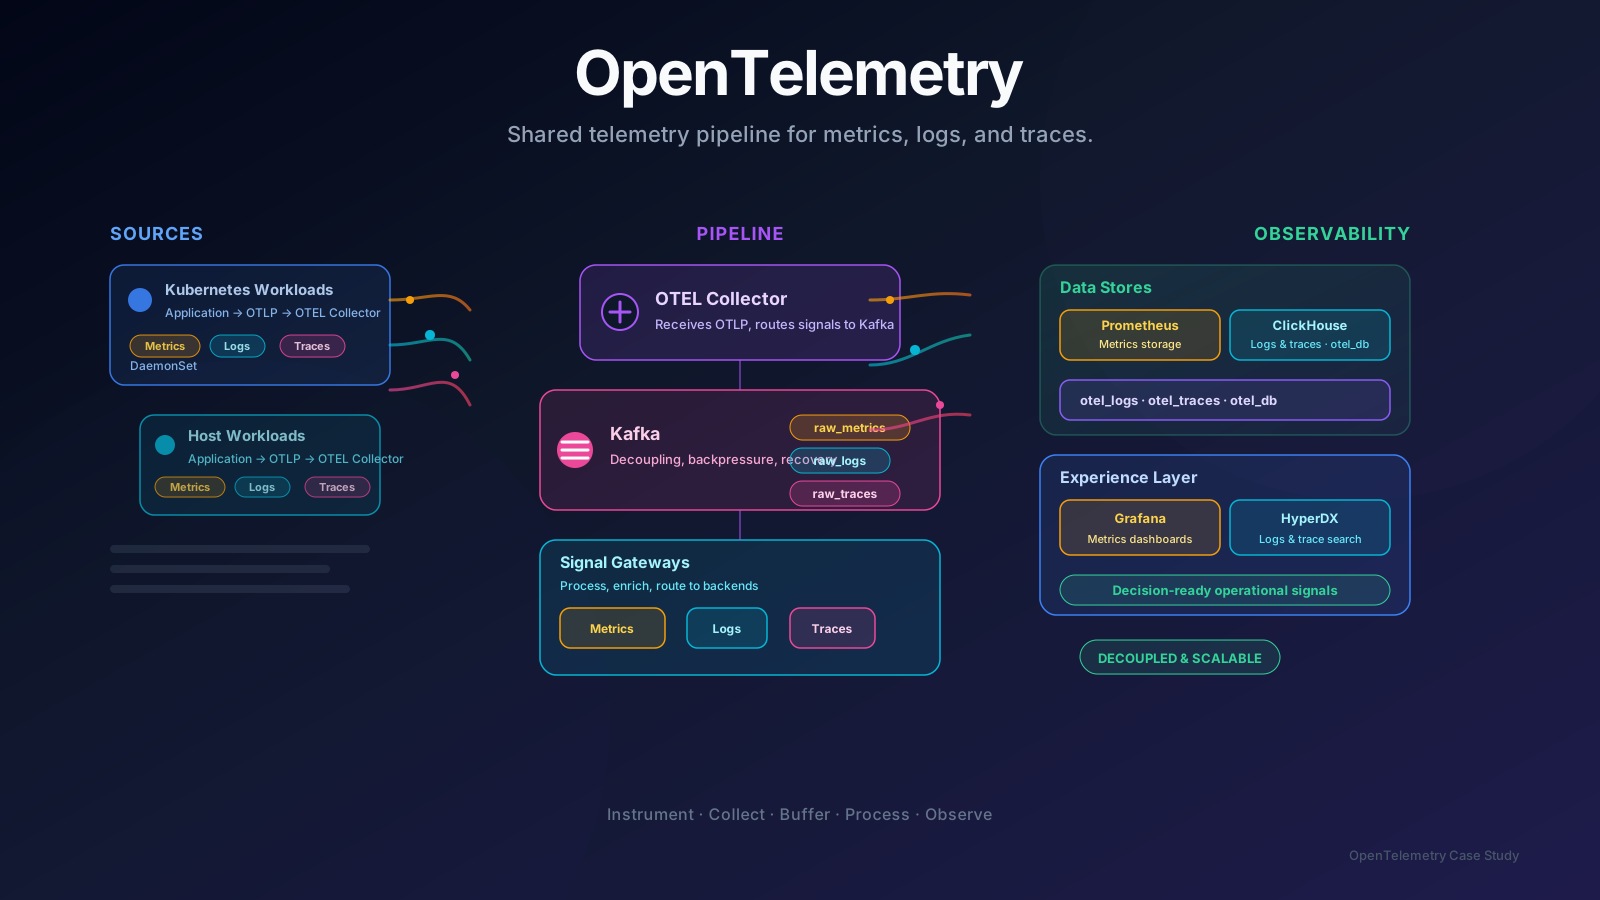
OTEL is a Kubernetes-based automation pipeline for OpenTelemetry-format signals from applications to observability backends. It standardizes application telemetry, separates ingestion from processing through Kafka, and reuses existing Prometheus, ClickHouse, Grafana, and HyperDX platforms.
Business Challenge
- Inconsistent telemetry patterns: Applications used varied logging, metric, and tracing mechanisms, limiting correlation and standardization.
- Scale and resilience: The platform needed controlled resource use, backpressure handling, fault tolerance, self-healing, and high availability.
- Data integrity: Pipeline design had to prevent loss under bursts, Kafka lag, gateway interruption, and downstream write pressure.
- Enterprise query needs: ETM required ClickHouse log storage and full-text search of body and important fields.
- Security: Telemetry could inadvertently include secrets, credentials, or keys.
Program Context
- Scope: Kubernetes-based OTEL telemetry for logs, metrics, and traces. The ETM pilot is limited to Connector logs.
- Projected Pilot Volume: One of the pilot team stated a worst-case projection of 2.5 million messages per day: 500 executions with 5,000 messages per execution.
- Platform Direction: OTEL Collector runs as a Kubernetes DaemonSet, Kafka decouples processing, and OTel Gateway deployments scale through HPA.
- Existing Backends: Prometheus stores metrics. ClickHouse stores OTEL logs and traces in otel_db. Grafana and HyperDX provide the user experience.
Responsibilities
- Align scope, operating cadence, and adoption sequencing
- Surface cross-team dependencies and risks
- Connect technical signals with stakeholder decisions
Execution
Created common practices around instrumentation, telemetry, and operational review.
Pipeline Implementation
- Deployed OTEL Collector as a Kubernetes DaemonSet with OTLP gRPC and HTTP/HTTPS receivers.
- Added Kafka exporters for logs, metrics, and traces, using separate raw-signal topics.
- Deployed OTel Gateways with processing, backend exporters, and HPA.
- Configured Prometheus for metrics and ClickHouse for logs and traces.
- Connected Grafana and HyperDX to the relevant data sources.
Performance Testing and Tuning
- Tested 135 million logs in 2–3 minutes, above ETM’s projected 2.5 million messages per day.
- Observed initial data loss in a 36-million-log test; changed gateway memory-limiter settings, increased exporter consumers from 10 to 20, and increased queue size from 10,000 to 100,000.
- Follow-up 36-million and 90-million-log tests reported no data drop.
- A continuous test reached 5 GB per minute and was stopped after 1.73 billion records because of development-pod storage constraints.
Outcomes
- Common telemetry pipeline: OTEL Collector → Kafka → OTel Gateway → Prometheus / ClickHouse architecture completed.
- Capacity evidence above pilot demand: 135 million logs tested in 2–3 minutes against ETM’s stated 2.5-million-message daily projection.
- Data-loss remediation validated: Queue and memory tuning produced no data loss at 36 million and 90 million log tests.
- Operational controls implemented: Alerting covers availability, Kafka lag, stale lag metrics, exporter failures, queue failures, and receiver refusals.
- Pilot and architecture governance active: Pilot run and Architecture Review Board approval process are in progress.
Lessons Learned
- Kafka is a resilience boundary: Decoupling ingestion and processing supports burst management and downstream protection.
- Pilot workload is not sufficient for capacity planning: Independent testing above ETM demand was necessary.
- Measured tuning matters: Gateway queue and memory adjustments eliminated observed data loss in follow-up tests.
- Storage is a platform dependency: A healthy pipeline can still be constrained by test-environment storage.
- Telemetry security begins at the source: Application teams must sanitize data until automated secret detection is available.
- Alerting is part of the product: Availability, lag, export, queue, and receiver signals are required operational controls.
Architecture
Shared telemetry flow
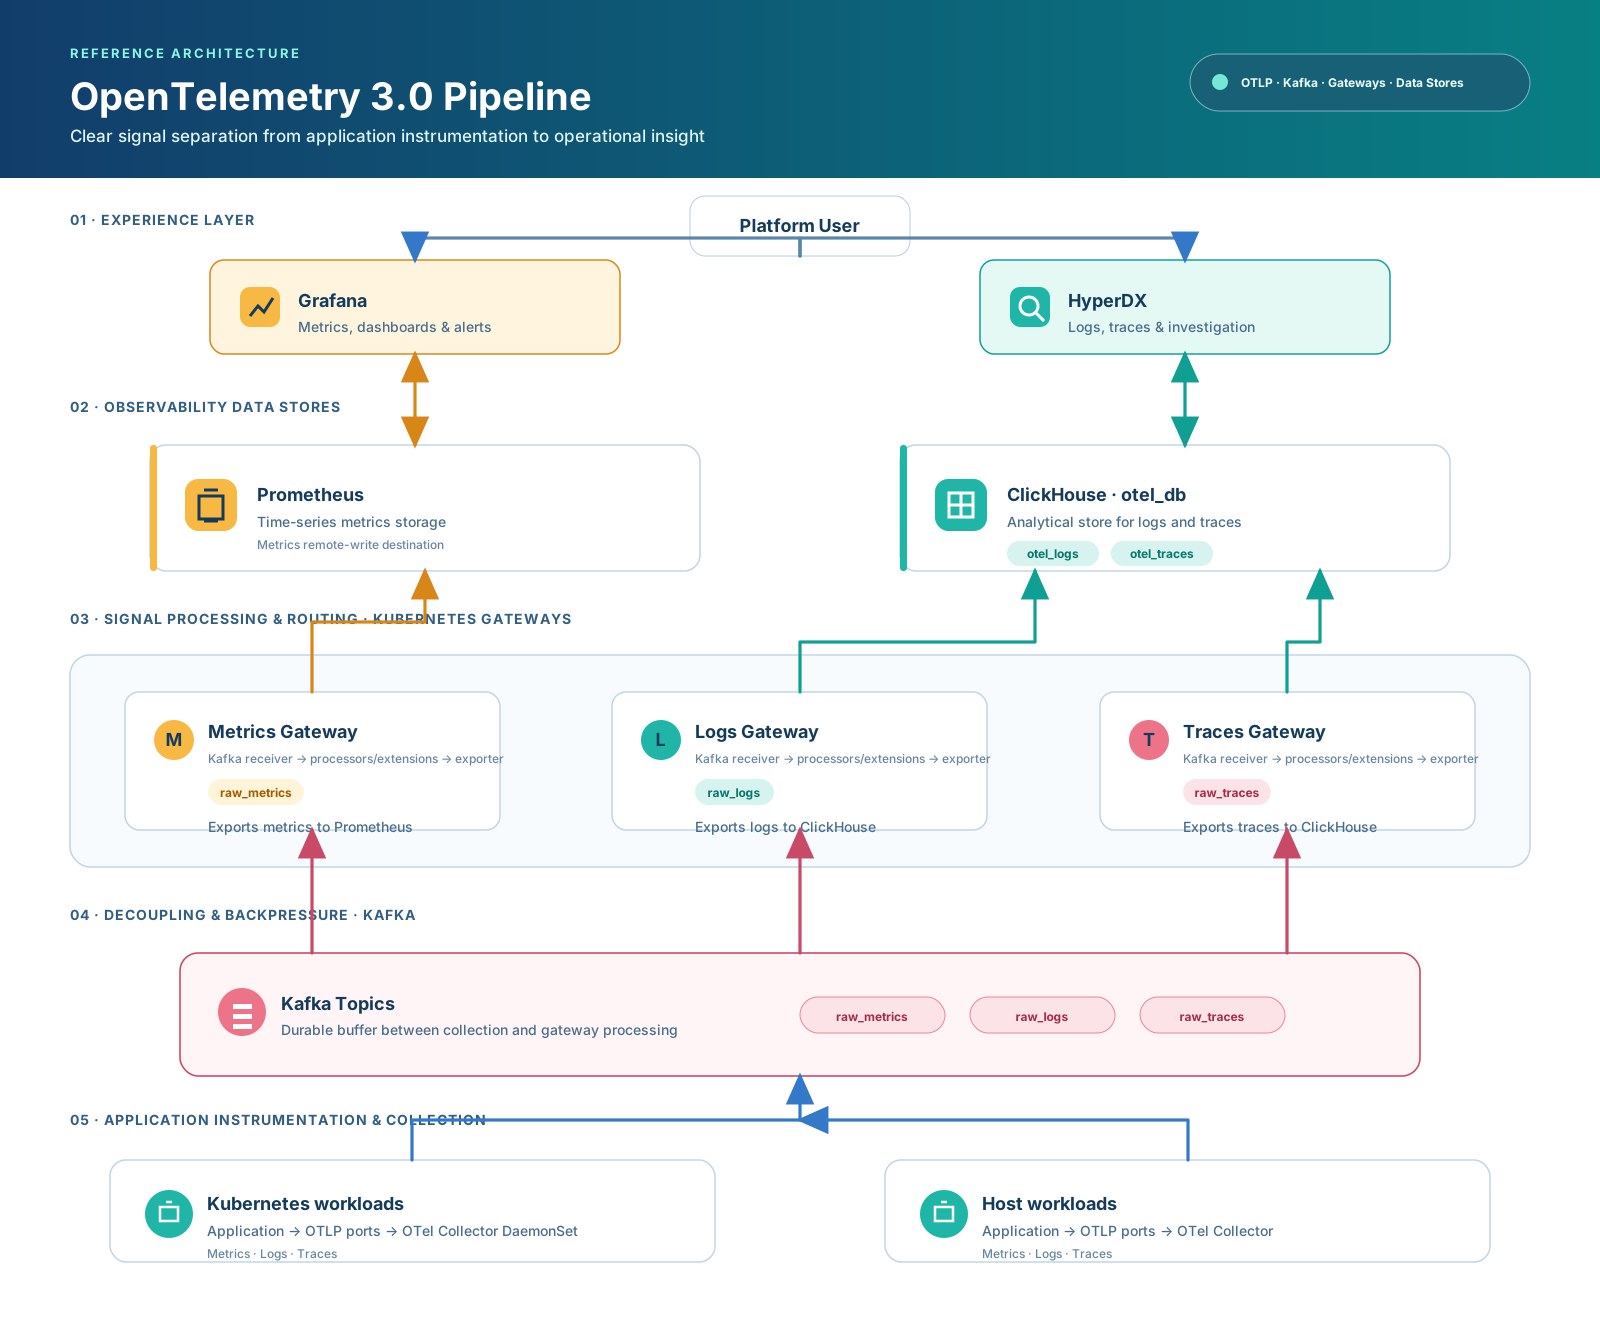
Service telemetry moves through common instrumentation and collection practices into decision-ready operational signals.
Layer 01
Experience Layer
The Experience Layer is where users consume and investigate observability data. Grafana provides dashboards, metric visualization, and alerting. HyperDX provides log and trace search, correlation, and troubleshooting. Users query these interfaces rather than accessing Prometheus, ClickHouse, Kafka, or OTEL components directly. This layer converts raw telemetry into operational insight for engineering, SRE, and support teams.Layer 02
Observability Data Stores
This layer persistently stores processed telemetry. Prometheus stores time-series metrics such as CPU, memory, error rate, latency, and application health. ClickHouse stores high-volume logs and traces in the otel_db database. otel_logs stores log records. otel_traces stores trace spans and distributed-tracing information.Layer 03
Signal Processing & Routing — Kubernetes Gateways
This layer receives telemetry from Kafka and sends it to the correct backend. Each signal has a dedicated Gateway: Metrics Gateway: Consumes raw_metrics and exports metrics to Prometheus. Logs Gateway: Consumes raw_logs, processes or enriches logs, and exports them to ClickHouse. Traces Gateway: Consumes raw_traces, processes or enriches traces, and exports them to ClickHouse. Each Gateway contains: Kafka receiver: Reads the assigned signal topic. Processors/extensions: Enrich, batch, filter, or apply resource controls to incoming telemetry. Exporter: Delivers processed telemetry to Prometheus or ClickHouse. Separating these Gateways prevents one signal type from overwhelming or blocking another.Layer 04
Decoupling & Backpressure — Kafka
Kafka is the buffer between telemetry collection and downstream processing. It uses dedicated topics: raw_metrics raw_logs raw_traces Kafka enables: Decoupling: Applications and Collectors can continue sending data even if a Gateway or storage backend slows temporarily. Backpressure handling: Kafka retains messages while consumers catch up. Independent scaling: Metrics, logs, and traces can be processed at different rates. Recovery: Gateways can restart and resume consumption from Kafka. Operational monitoring: Consumer lag indicates whether Gateways are keeping up with ingestion volume.Layer 05
Application Instrumentation & Collection
This is the source layer where telemetry originates. Applications on Kubernetes and host/VM environments generate metrics, logs, and traces. Applications emit telemetry using the OpenTelemetry format. Telemetry is pushed through OTLP endpoints over gRPC or HTTP/HTTPS. The OTEL Collector receives the signals. On Kubernetes, it runs as a DaemonSet. On hosts, it runs as an OTEL Collector service. The Collector identifies the signal type, applies configured collection processing, and publishes it to the corresponding Kafka topic.
Operating model
Stakeholder matrix
| Stakeholder | Engagement |
|---|---|
| Service teams | Instrumentation adoption and signal quality |
| Platform and reliability teams | Shared capabilities and operational review |
| Engineering leadership | Program alignment and risk visibility |
Risk discipline
Risks and responses
Risk
Inconsistent instrumentation limits signal quality
Response
Sequence adoption around common practices and ownership
Risk
Storage exhaustion
Response
Plan development and production storage capacity before long-running high-volume validation.